
Understanding Thunderstorm Outlooks
Long description
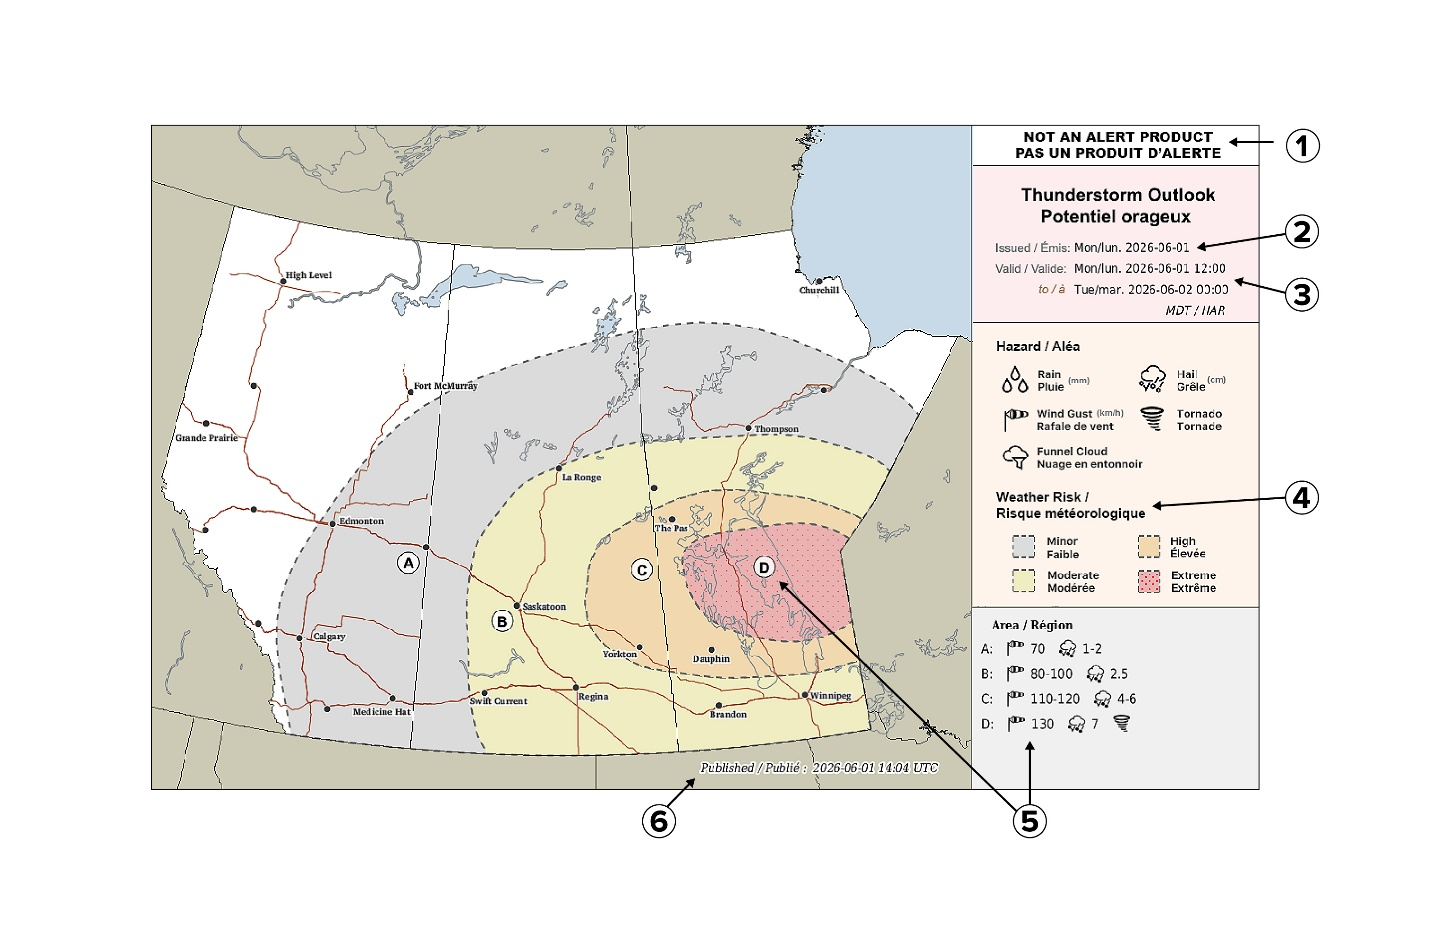
A sample Thunderstorm Outlook for Alberta, Saskatchewan, and Manitoba, with cities such as Edmonton, Saskatoon, Regina, Winnipeg, and Thompson labeled.
Coloured areas on the map indicate different levels of thunderstorm risk.
A large grey area labeled "A" covers much of southeastern Alberta, parts western and northern Saskatchewan and parts of northern Manitoba, representing a minor risk of thunderstorms.
Inside the grey area is a light-yellow zone labeled "B," over parts of Saskatchewan and Manitoba, indicating a moderate risk of thunderstorms.
Within the yellow area is a smaller, light orange zone labeled "C," covering central Saskatchewan and parts of southern and central Manitoba. This represents a high risk of thunderstorms.
At the centre of the map is a light red, dotted area labeled "D," located over parts of central Manitoba. This indicates an extreme risk of thunderstorms.
A panel on the right side of the image provides additional information. It states that this product is not an alert, meaning it is for awareness only. It includes the issue date and valid time period for the outlook.
The panel also lists possible hazards associated with thunderstorms:
- Heavy rain
- Hail
- Strong wind gusts
- Tornadoes
Below this, a legend explains the colour-coded risk levels: grey = minor, light yellow = moderate, light orange = high, and light red = extreme.
Important components of the Thunderstorm Outlook are numbered one through six, and the web content below describes each component, to help you understand how to use a Thunderstorm Outlook.
1. This is not an alert
A thunderstorm outlook is not an alert.It shows areas where weather conditions are favourable for a thunderstorm to develop in the next day or two.2. Issued time
This tells you when forecasters last updated the outlook. Forecasters usually issue "Today's" thunderstorm outlook in the morning. In the early afternoon, they update "Tomorrow AM" and "Tomorrow PM."
3. Valid time
This shows the timeframe for which the outlook applies (all times are local):
- Today:Noon to midnight
- Tomorrow (AM):Midnight to noon
- Tomorrow (PM):Noon to midnight
Be sure to check the Valid Time to ensure you are seeing the most up-to-date outlook.
4. Map colours (risk levels)
The map uses colours to show the level of risk associated with the potential weather hazards:
- Grey:Minor risk
- Yellow:Moderate risk
- Orange:High risk
- Red:Extreme risk
5. Hazard details
Each coloured area has a dashed outline and a letter. The letter matches the legend, which explains the possible weather hazards (like heavy rain, hail, or strong winds) for that area. Unlabeled areas of colour indicate a region of generalized risk of thunderstorms.
6. Publication date and time
This shows when the map was produced.
Features
Colour-coded weather alerts

Learn more about weather alerting in Canada
Thunderstorm Outlooks

Find the Thunderstorm Outlook for your area.
- Date modified: